Tubient vs TubeBuddy vs vidIQ: which YouTube analytics tool fits you? (2026)
2026-10-31
YouTube Studio shows what happened. Tubient shows why.
The short answer
- Tubient is for creators who want to understand their own channel: which videos grew it, why a video underperformed, and what's actually changing in the numbers.
- TubeBuddy is for creators who want to work faster inside YouTube Studio: keyword research, bulk edits, and thumbnail A/B testing from a browser extension.
- vidIQ is for creators who want ideas and reach: trend research, keyword scores, competitor tracking, and an AI coach.
They do different jobs. Plenty of creators will end up using one of the other two alongside Tubient.
At a glance
Prices are US list prices for one channel, checked on 31 October 2026. They change often, so check each tool's pricing page before you buy.
| Tubient | TubeBuddy | vidIQ | |
|---|---|---|---|
| Paid price | Creator: $20/month | Pro: $15/month ($12/month billed yearly). Legend: $32.99/month ($26.39/month billed yearly) | Boost: $19/month ($199/year). MAX: $49/month ($468/year) |
| Free plan | Yes | Not listed on the pricing page | Yes, with 150 AI credits a month |
| Main job | Explaining why your channel's numbers moved | Optimising and managing videos inside Studio | Finding ideas, keywords and trends |
| Who it's for | Creators who want answers about their own channel | Creators publishing regularly who want SEO and workflow tools | Creators who want growth research and coaching |
Where Tubient is the better pick
You want to know which videos actually grew your channel
This is the question I built Tubient to answer. Studio will show you that subscribers went up. It won't tell you which videos did the work, or whether that one video that "went viral" brought in subscribers or just views.
In Tubient you ask it in plain English: "Which long and short form videos have been driving subscriber growth over the last 90 days?" The AI builds the analysis on a visual canvas, pulls the data, and writes up the answer with the reasoning behind it.
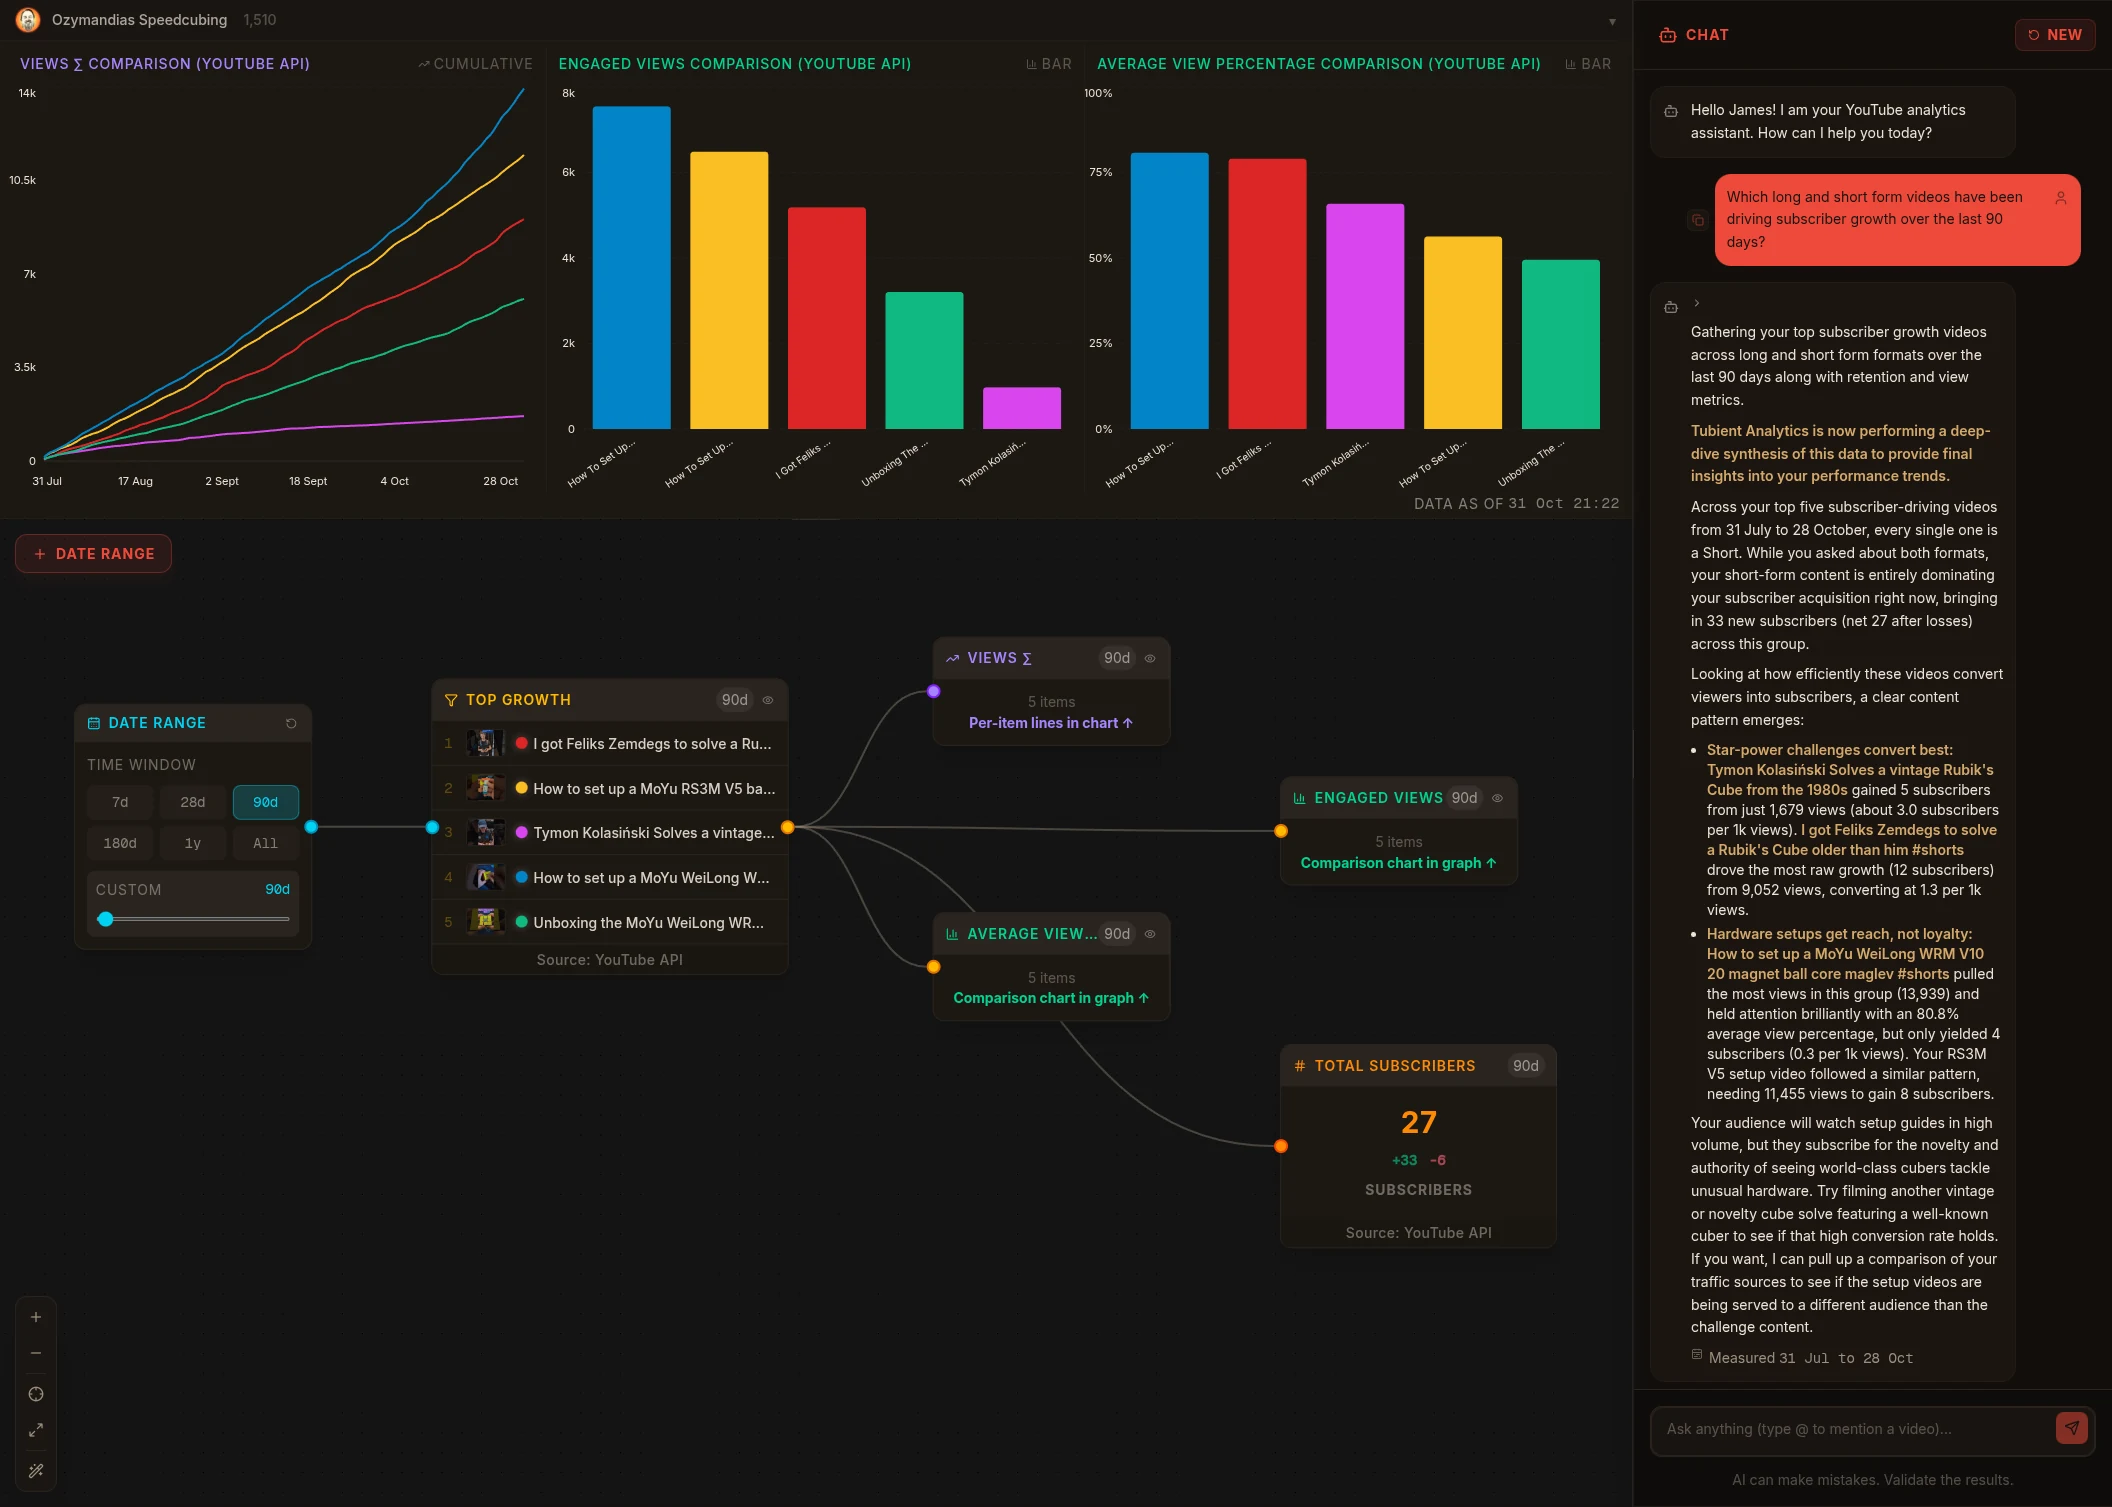
All five of the top videos were Shorts, but the surprise was which ones. My most-watched Short in that group, a maglev setup guide, took 13,939 views to gain 4 subscribers. Tymon Kolasiński solving a vintage 1980s cube gained 5 from just 1,679 views. People watch my setup guides, but they subscribe to see world-class cubers on strange old cubes.
A video underperformed and you want to know why
TubeBuddy and vidIQ are mostly about getting a video found before and after you publish. When a video flops, they'll show you more numbers. Tubient looks at the video against the rest of your channel and explains what was different: was it the click-through, the retention, where the views came from, or the format? Click-through data is a Premium Node.
When it compares your videos, it sticks to long-form unless you ask for Shorts, so your Shorts don't muddy the comparison and make a normal video look like a dud.
You don't even need to know which video to start with. I asked Tubient "Which video under-performed the most over the last year?" It pulled my five long-form videos with the worst retention and compared them over the last 365 days.
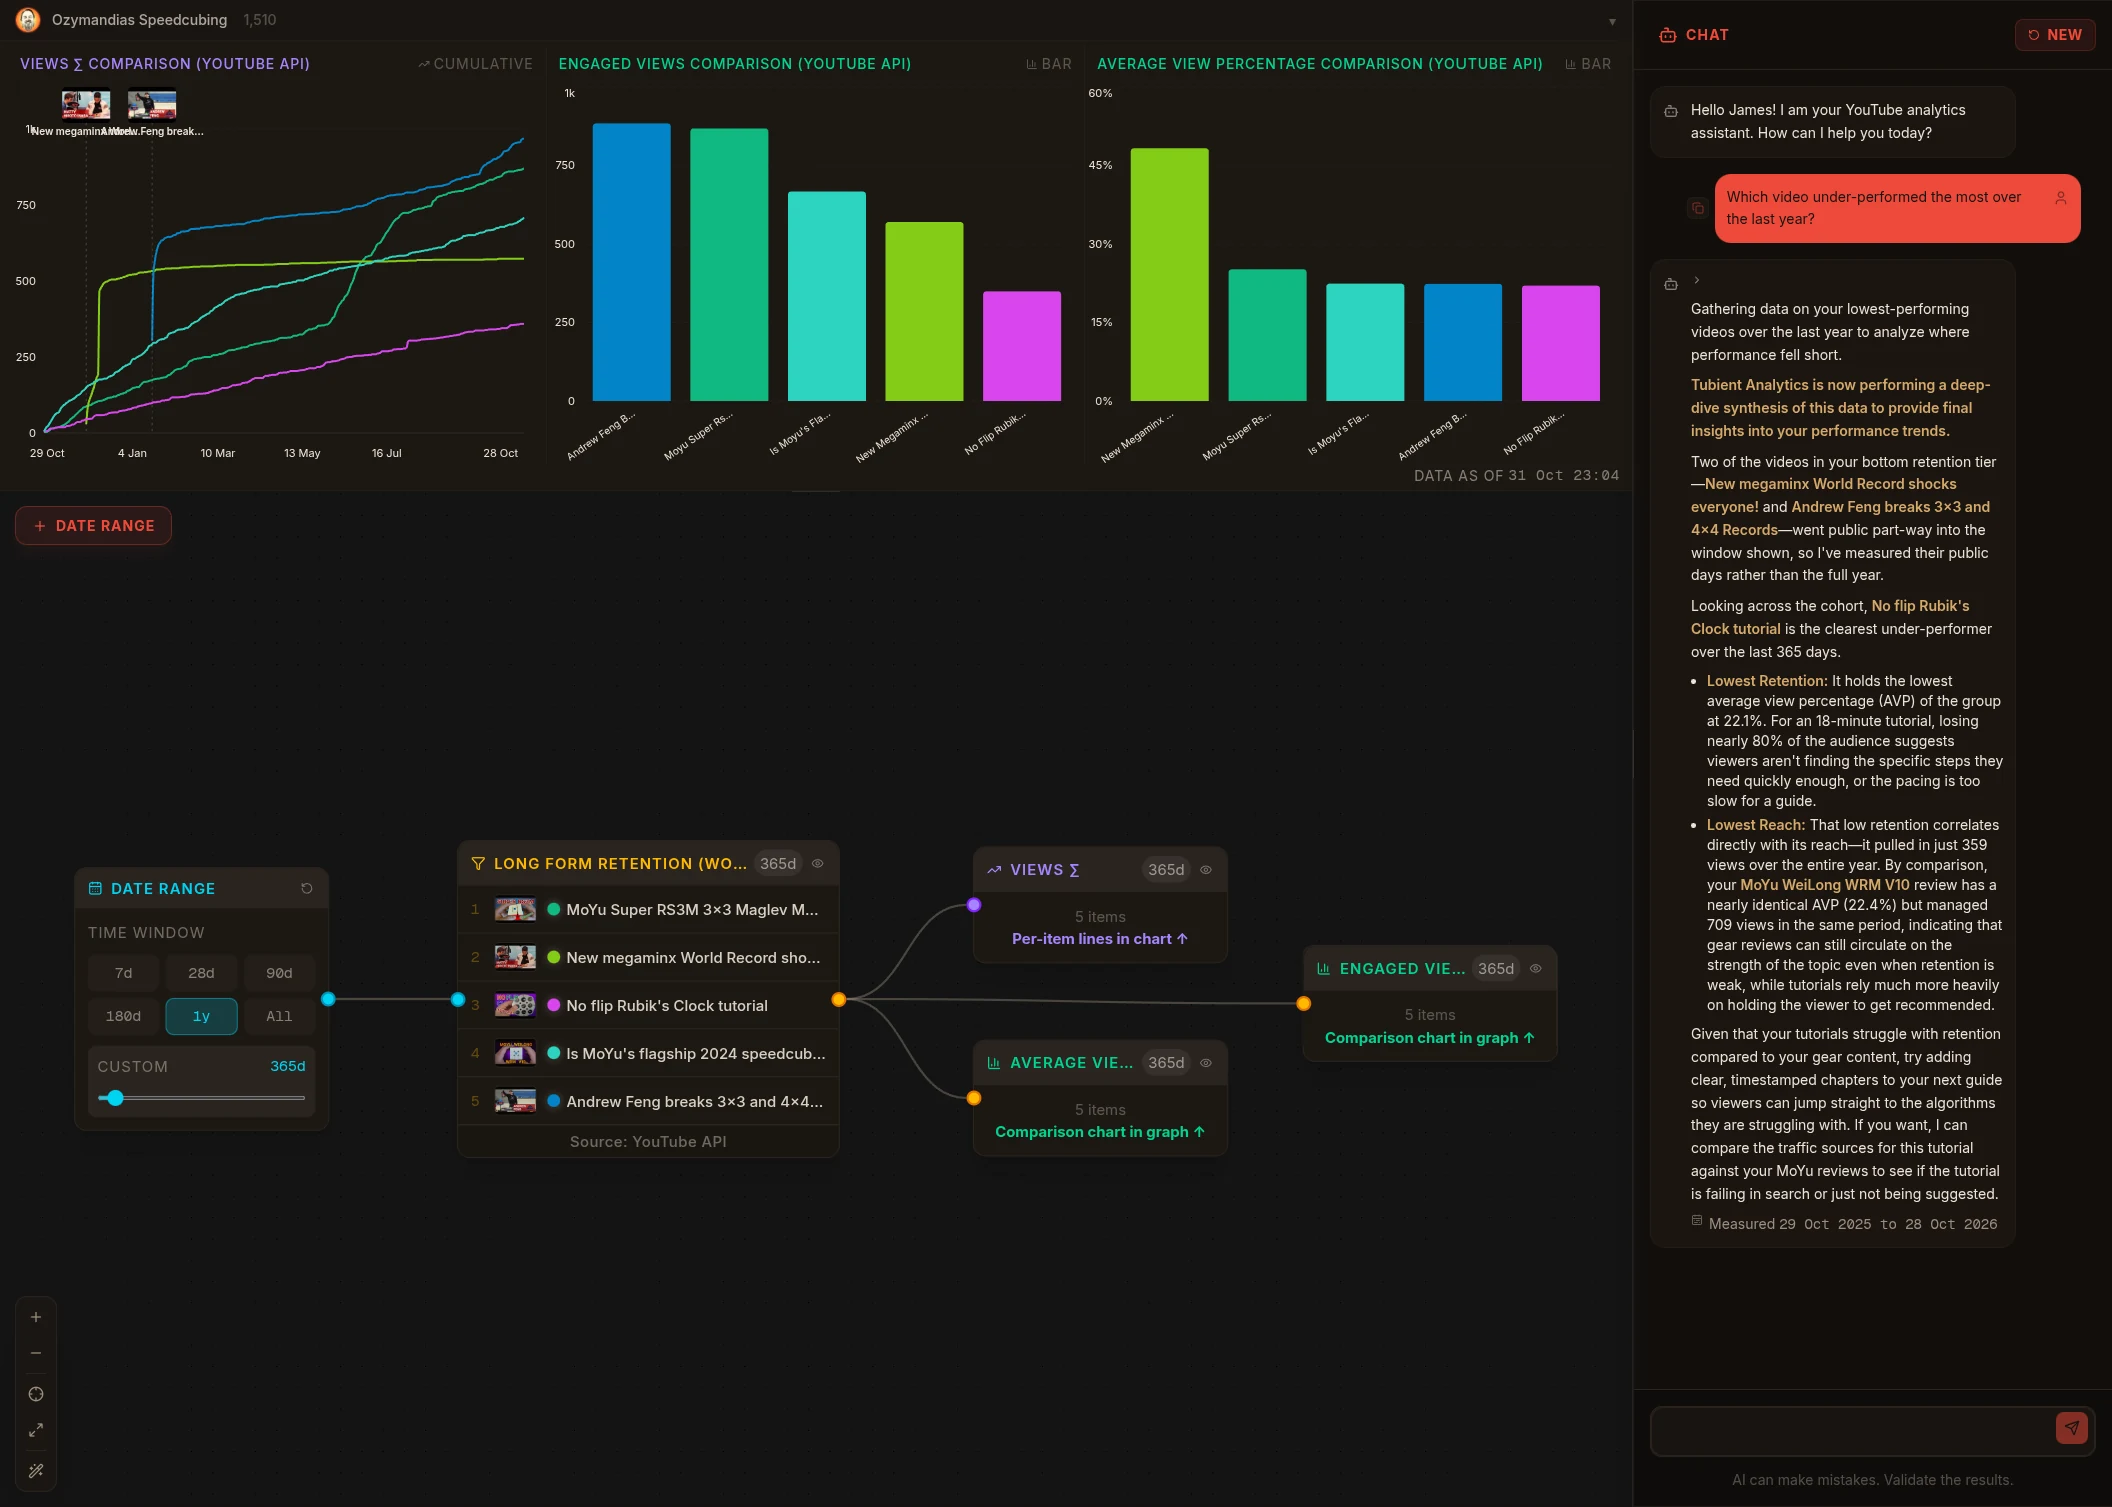
It picked my no-flip Rubik's Clock tutorial: 359 views all year, and viewers watched just 22.1% of it on average, which is rough for an 18-minute guide. The useful part was the comparison. My MoYu WeiLong WRM V10 review held viewers about as badly, at 22.4%, but got 709 views, nearly twice as many. Tubient's read was that a gear review can still get around on the strength of its topic, while a tutorial needs to hold people to get recommended. It suggested timestamped chapters so viewers can jump to the algorithm they're stuck on, and offered to check whether the tutorial is failing in search or just not being suggested.
Your numbers don't agree with each other
YouTube changed how it counts views on 27 August 2026, and a lot of creators suddenly saw numbers that didn't line up. Tubient has Engaged Views on every plan, so you can compare like with like across the change instead of guessing whether your channel actually dropped. Engaged View Rate, the share of your views that were engaged, is a Premium Node.
Here's my own channel. I asked: "Compare my daily views and engaged views since 1 July. Did my channel actually grow after YouTube changed how it counts views on 27 August?"
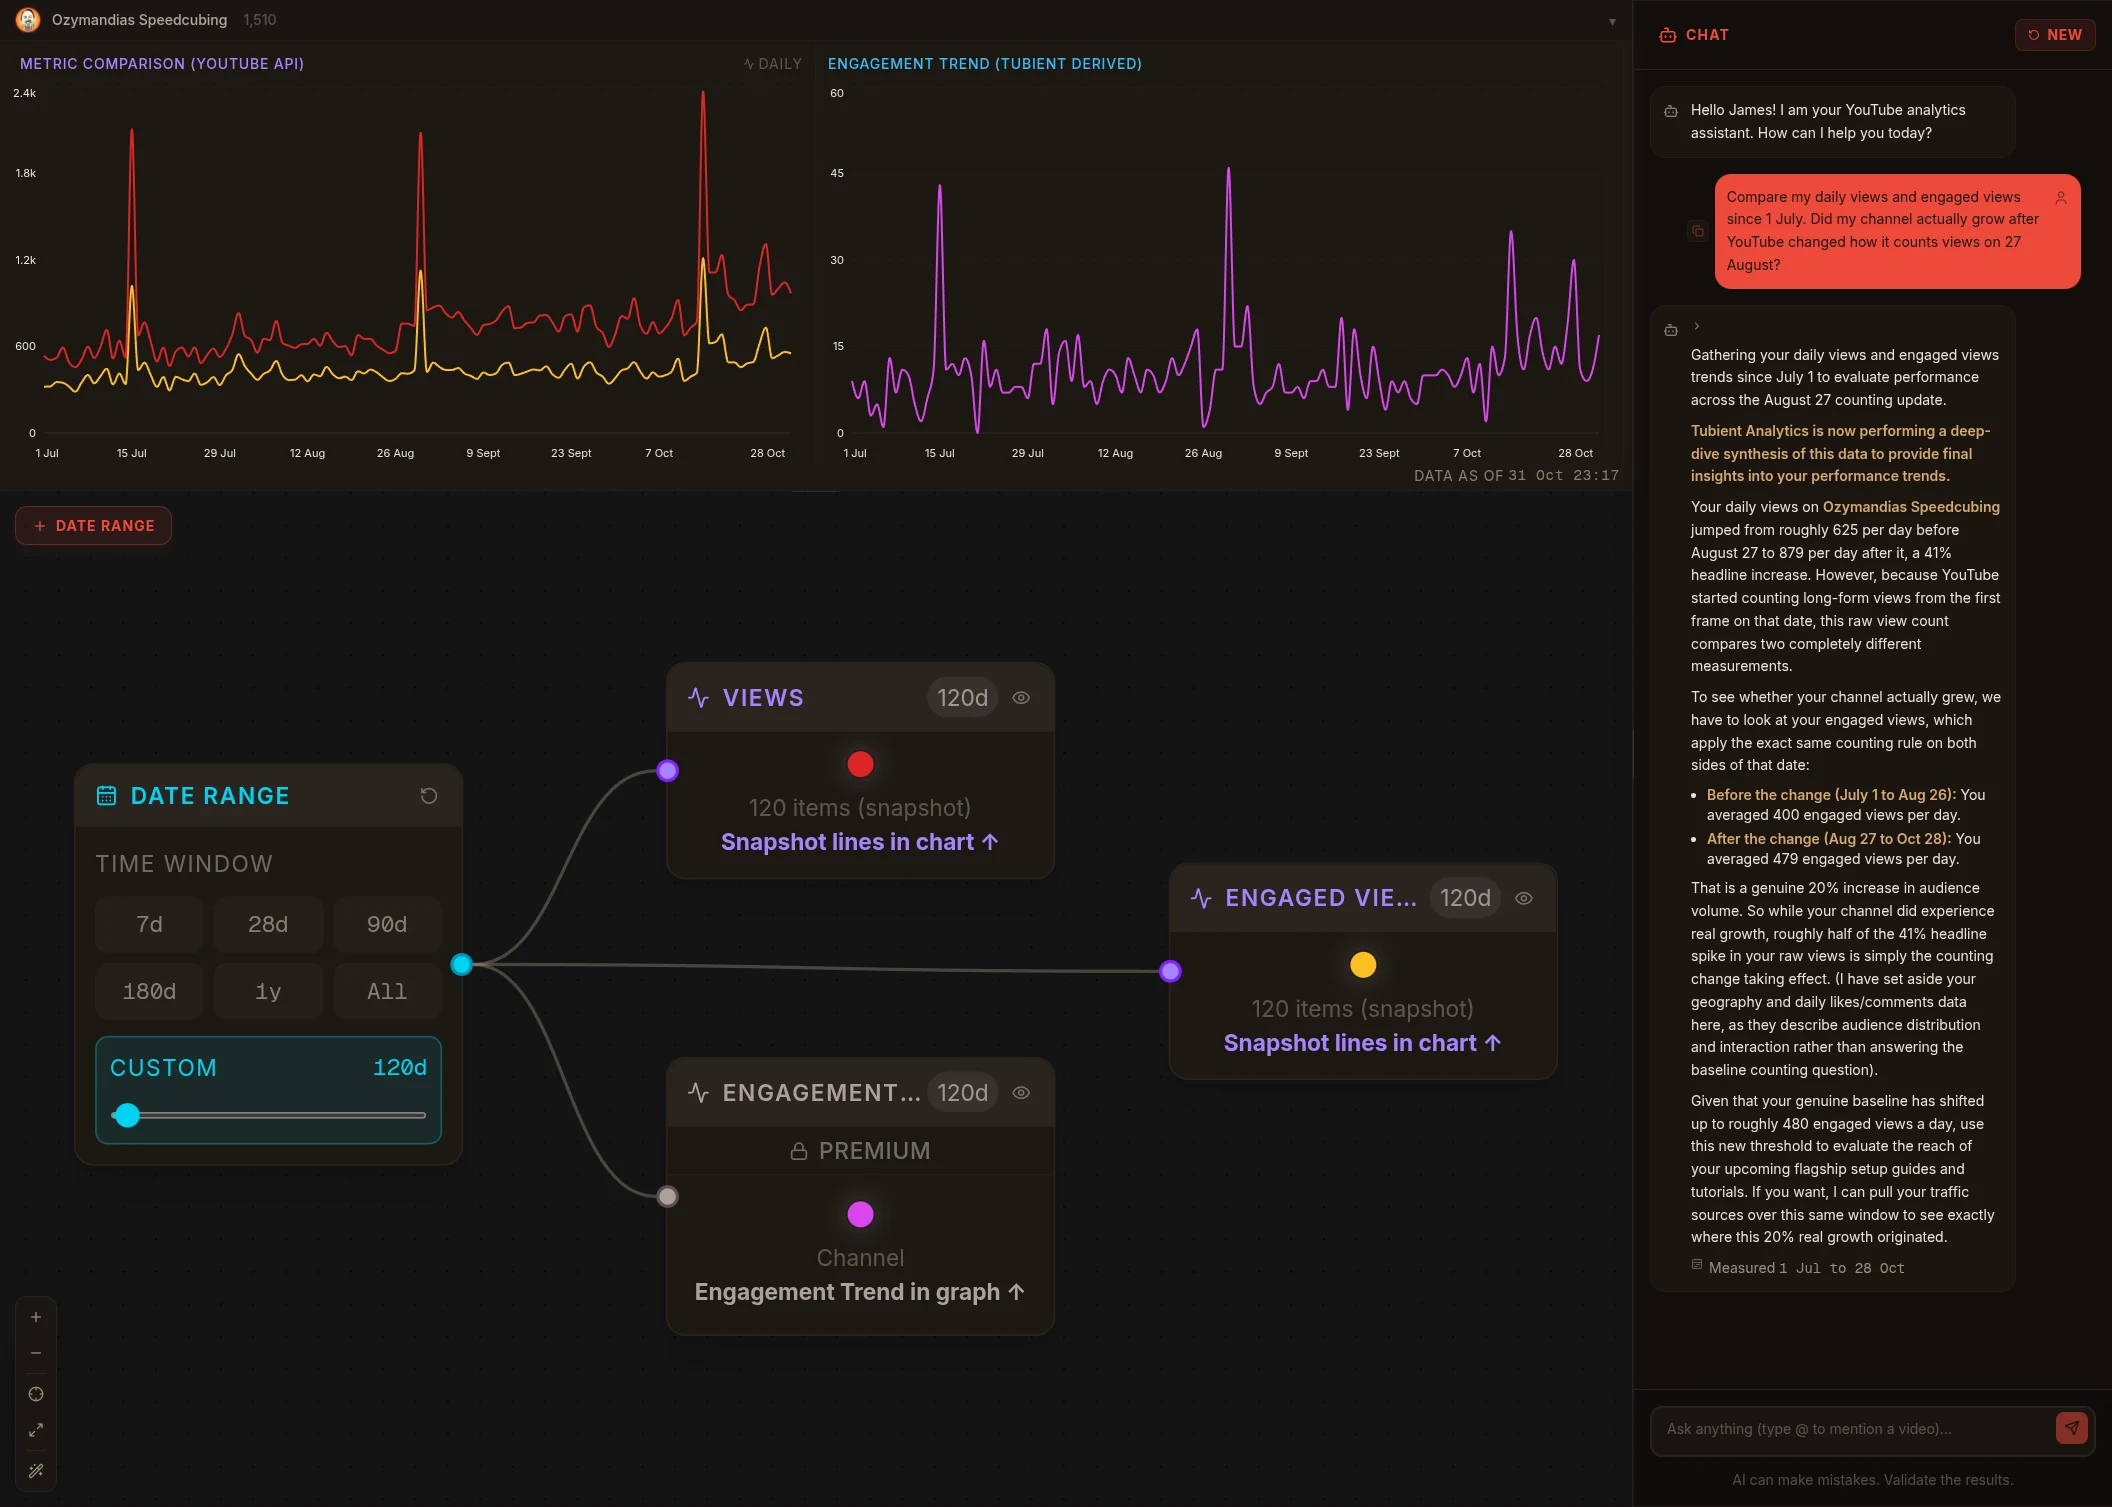
Tubient added a Geography node I didn't need, so I deleted it to give the charts more room. You can delete or hide any node on the canvas. I kept Engagement Trend, a Premium Node showing daily likes and comments, because those don't depend on how views are counted.
Views went from about 625 a day to 879, up 41%. Engaged views went from 400 to 479, up 20%. The number I trust is the share of views that were engaged: 64% before the change and 55% after, and it has stayed there. Most of the real growth came later, too. In September my engaged views were only about 7% above where they'd been, and the bigger rise came in October.
This chart is my whole channel, Shorts included. Shorts moved to the new counting in 2025, so the change to long-form views is bigger than these totals show.
Where TubeBuddy or vidIQ is the better pick
I'd rather you pick the right tool than the one I built, so here's where the other two are stronger.
Keyword research and SEO. Both TubeBuddy and vidIQ have mature keyword tools, tag suggestions and search scores. Tubient doesn't do keyword research. If your main problem is getting found in YouTube search, start with one of them.
Working inside YouTube Studio. TubeBuddy and vidIQ both run as browser extensions, so their tools sit right next to your upload screen. Tubient is a separate web app.
Thumbnail testing and bulk edits. TubeBuddy's Legend plan has thumbnail A/B testing and bulk tools for updating cards, end screens and descriptions across hundreds of videos. If you manage a big back catalogue, that saves real time. (YouTube Studio's own Test & Compare also does thumbnail testing for free.)
Ideas, trends and competitors. vidIQ is built around what to make next: trend research, daily ideas, competitor tracking and an AI coach. Tubient is built around understanding your own channel's data, not scanning the rest of YouTube.
Scale and track record. Both have been around for years, have big user bases and offer plans for agencies and multi-channel teams. Tubient is a newer tool built by one person (me).
FAQ
What's a good alternative to vidIQ?
It depends on what you use vidIQ for. If it's keyword research and SEO, TubeBuddy is the closest alternative. If you want to understand why your videos perform the way they do rather than find new keywords, Tubient does that. It has a free plan, though click-through data needs the Creator Plan.
How do I see why a YouTube video underperformed?
In YouTube Studio, open the video's analytics and compare its click-through rate, average view duration and traffic sources against your channel's typical numbers. That takes a while and you still have to work out the "why" yourself. In Tubient you can just ask which video under-performed and why, and get a written answer based on your channel's data.
Is TubeBuddy or vidIQ better?
TubeBuddy is stronger for workflow inside Studio: bulk edits, A/B testing and SEO checks while you upload. vidIQ is stronger for research: trends, ideas and competitor tracking. Neither is mainly built to explain why your own videos performed the way they did.
Is there a free YouTube analytics tool?
YouTube Studio is free and has all your raw data. Tubient and vidIQ both have free plans. TubeBuddy's public pricing page currently lists paid plans only.
Can I use Tubient with TubeBuddy or vidIQ?
Yes. They don't overlap much. A common setup is TubeBuddy or vidIQ to get videos found, and Tubient to understand what happened after they went live.
Does Tubient do keyword research or thumbnails?
No. Tubient focuses on explaining your channel's performance. For keywords and thumbnail testing, TubeBuddy, vidIQ or Studio's own Test & Compare are better choices.
If something here is out of date, tell me in the Discord and I'll fix it.