The Dashboard
The Tubient dashboard is split into two primary interaction zones, designed to keep your data at the top and your logic at the bottom.
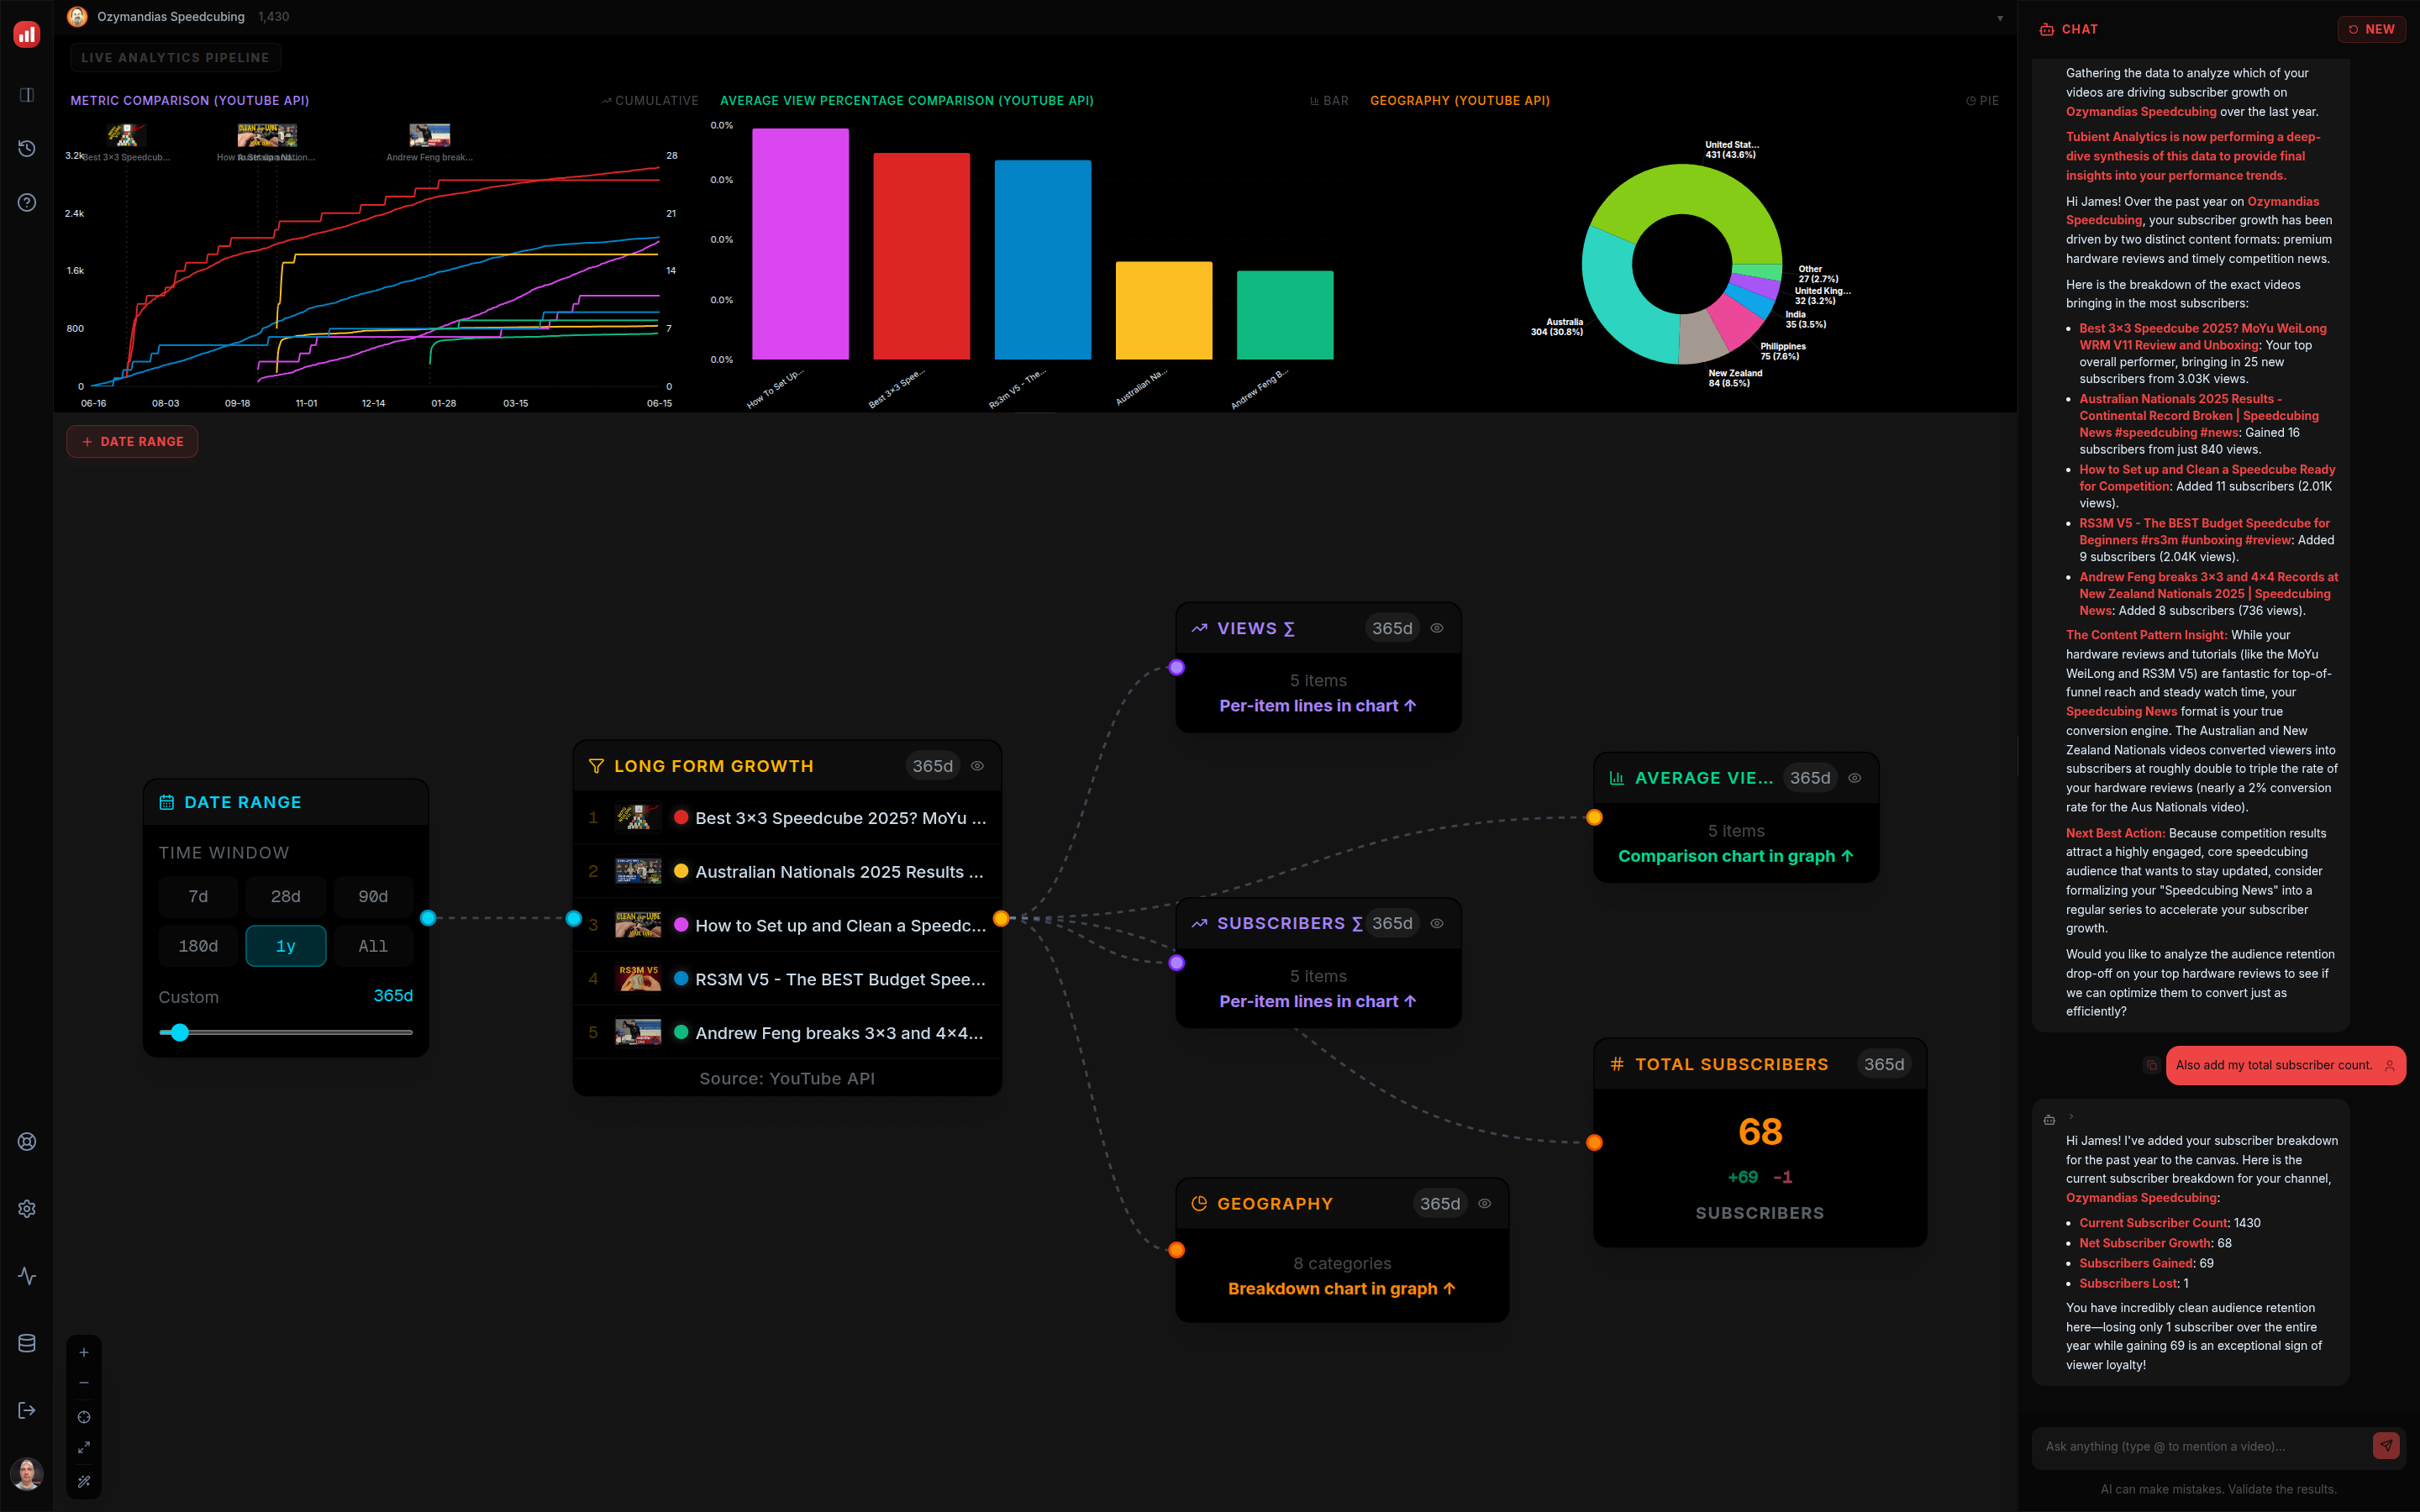
Active Viewing Area (Top)
The top 40% of the screen is dedicated to your Live Chart. All temporal metrics (data that changes over time) are plotted here as color-coded lines. When you add nodes that provide "snapshot" data (like geographic breakdowns), separate panels dynamically appear next to the main line chart.
- Temporal Chart: Multi-series lines for views, subscribers, watch time, shares, etc.
- Snapshot Panels: Categorical data shown as Bar or Pie charts. Each panel features an independent toggle to switch its visualization mode.
- Verified Channels Dropdown: Manage your connected YouTube channels from the account menu. It displays your verified channel thumbnail and custom name returned directly from YouTube's API to ensure clear identity validation.
Pipeline Canvas (Bottom)
The bottom area is a high-performance interactive canvas powered by our visual engine. This is where your logic lives. Nodes are connected from left to right, matching the flow of data processing.
Canvas Controls
- SelectionClick a node to select it, or shift+click and drag a box across the canvas to select multiple nodes.
- MovementClick and drag nodes to rearrange them. Pan the canvas by dragging empty space, and zoom using your mouse wheel.
- HistoryPress Ctrl+Z to undo actions, and Shift+Ctrl+Z to redo them.
- DeletionSelect one or more nodes and press Del to remove them from the pipeline.
Canvas Navigation
The floating tools in the bottom-left of the canvas provide essential navigation and layout controls:
- ZoomUse the and buttons to zoom in and out of your pipeline.
- CenterThe Center View button re-centers the canvas on your current nodes while preserving your zoom level.
- Fit ViewThe Fit View button instantly zooms and pans to ensure your entire pipeline is visible.
- Tidy UpThe Tidy Up button automatically rearranges all nodes into a clean, optimized vertical-first layout.
Keyboard Shortcuts
Typical Pipeline Flow
Smart Breakdowns
Tubient uses an intelligent detection system to manage complex data relationships. When you connect a Filter Node to one of the following:
- Temporal Mode: If the metric is a trend over time (e.g., Views, Subscribers), use a Temporal Node (Violet). It displays multi-series lines in the main chart. Toggle Daily/Cumulative in the chart header.
- Comparison Mode: If you want to rank and compare videos (e.g., Likes per video), use a Comparison Node (Emerald). It displays aggregate Bar or Pie charts.
- Numeric Mode: If you want to compute totals or averages across the filtered videos (e.g., Total Views, Average Duration), use a Numeric Node (Orange). It displays a direct numerical stat callout.
- Premium Mode: If you want advanced ratio distributions or statistical z-scores (e.g., Retention Curve, relative performance), use a Premium Node (Taupe). It renders deep-dive analytics directly in the canvas.